Make data, ideas, and plans instantly understandable.
More than charts, MakeCharts helps you turn messy information into crisp visuals people grasp at a glance — diagrams, timelines, maps, frameworks, and more.
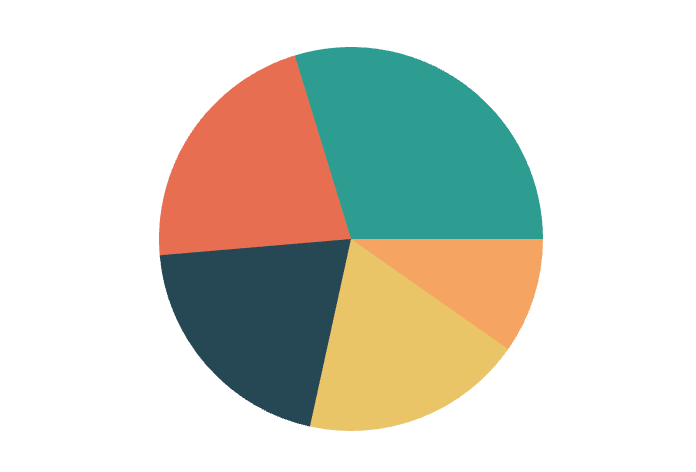
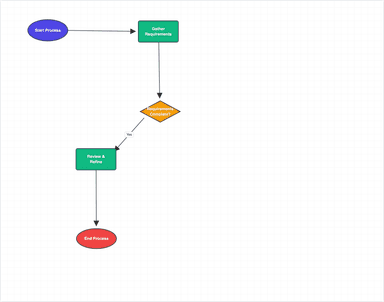
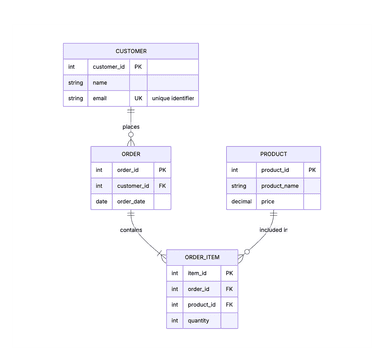
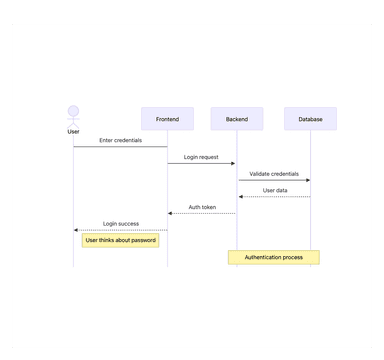
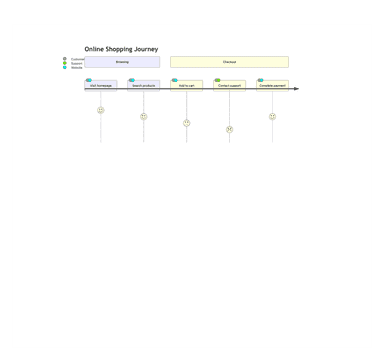
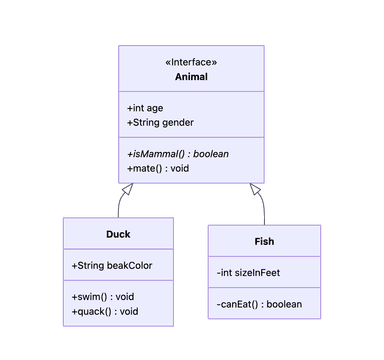
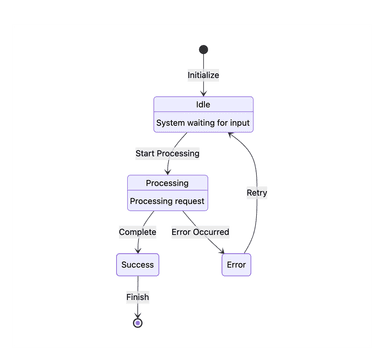
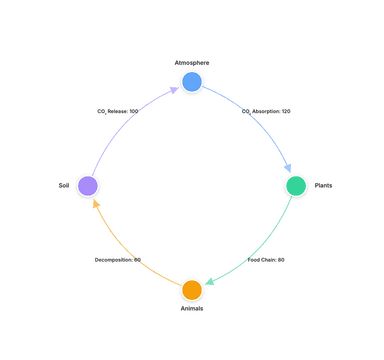
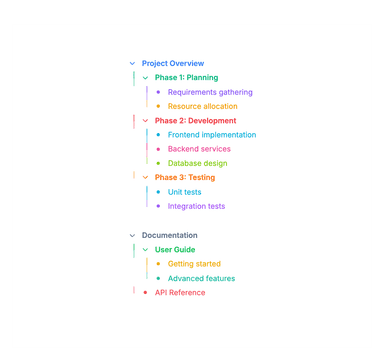
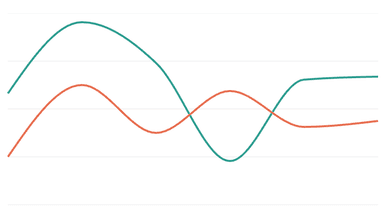
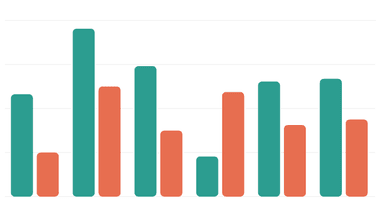
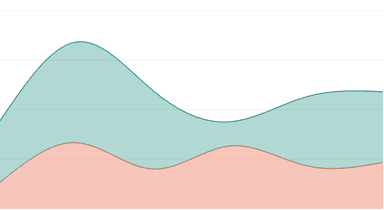
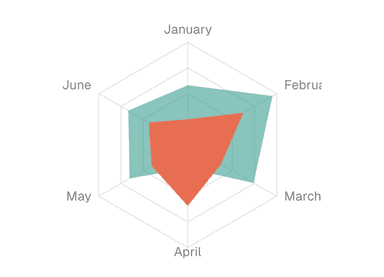
Chart Types for Every Idea
Pick the right visual to analyze, explain, or align - from data stories to planning workflows.

Loved by Creators
Teams use MakeCharts to explain insights, share ideas, and align plans with visuals.
“We use MakeCharts to turn messy inputs into visuals everyone understands. It keeps meetings focused and decisions aligned.”
Sarah K.
Strategy Lead
“From timelines to process maps, it is the fastest way I know to explain how things work without a design team.”
Michael T.
Product Manager
“MakeCharts helps us share ideas clearly and move from concept to plan. The visuals just click with people.”
Amir J.
Operations Lead
“I can move from a whiteboard sketch to a clean, shareable visual in minutes. It saves me hours every week.”
Lena M.
Program Manager
“We use it for roadmaps, org charts, and data updates. It brings structure to conversations fast.”
Carlos R.
Team Lead
“It bridges data and story. I can explain the why, not just the what, with a single visual.”
Priya N.
Insights Analyst
Frequently Asked Questions
What makes MakeCharts different from other chart tools?
MakeCharts is built for visual expression, not just data. It gives you charts, diagrams, and planning visuals in one place so you can explain ideas as clearly as you present numbers.
Can I use it for planning and communication, not just analytics?
Absolutely. Many teams use MakeCharts for roadmaps, workflows, org charts, and strategy maps to align stakeholders quickly.
How do I share or export my visuals?
Export to PNG, SVG, or PDF for decks and docs, or drop visuals into your workflow to keep everyone on the same page.
Do I need design skills to make something that looks good?
No. MakeCharts gives you polished layouts and smart defaults, so your visuals look clean and professional without extra effort.
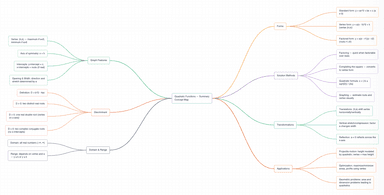
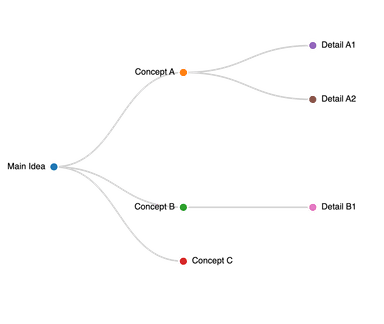
What kinds of visuals can I create?
Everything from classic charts to diagrams, mind maps, timelines, and flows. If it helps explain an idea, you can likely build it here.
Bring Clarity to What You Know.
Turn data, ideas, and plans into clear, shareable visuals in minutes. Start free.